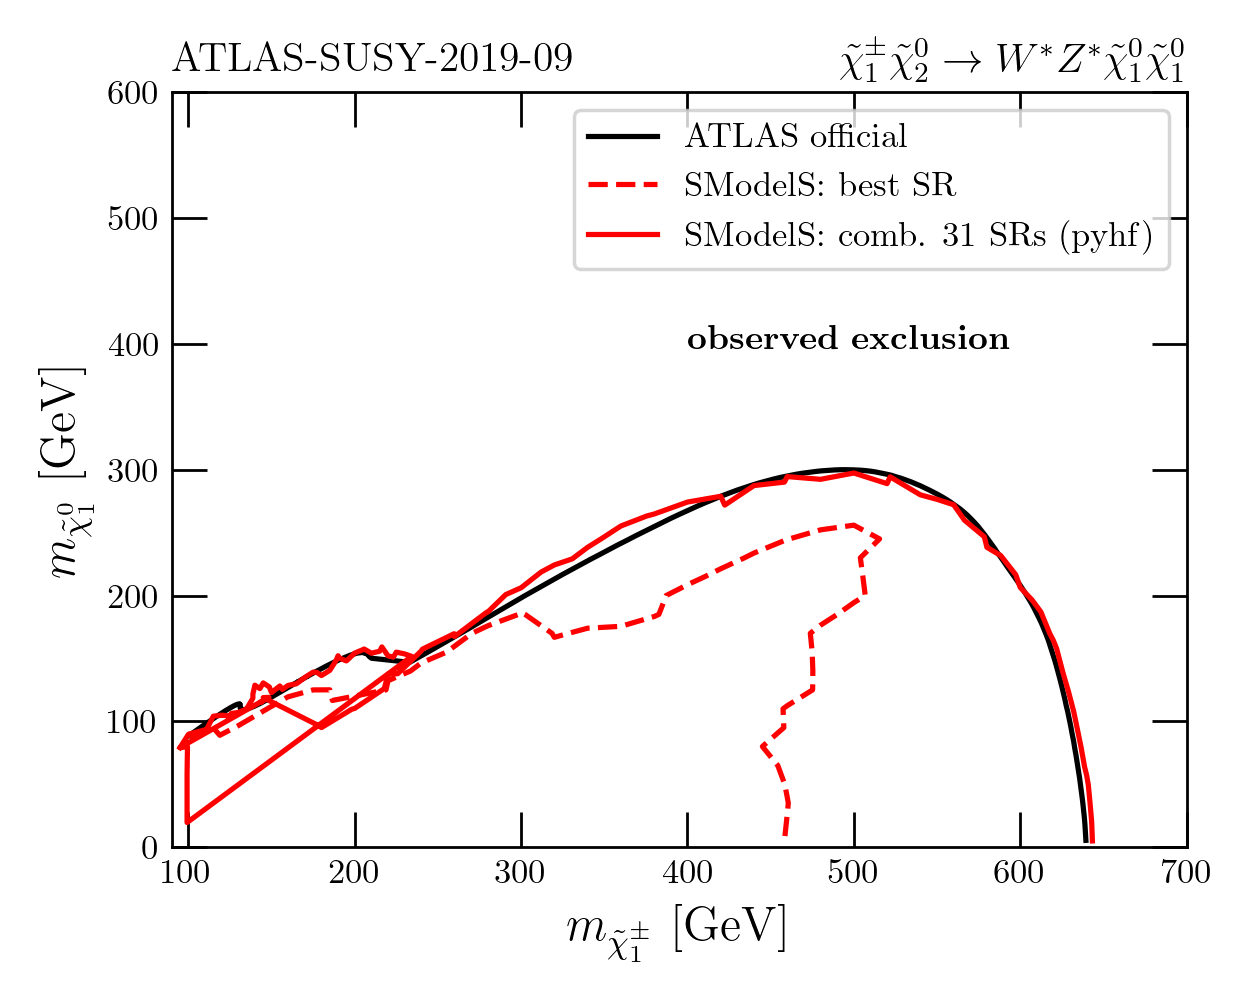
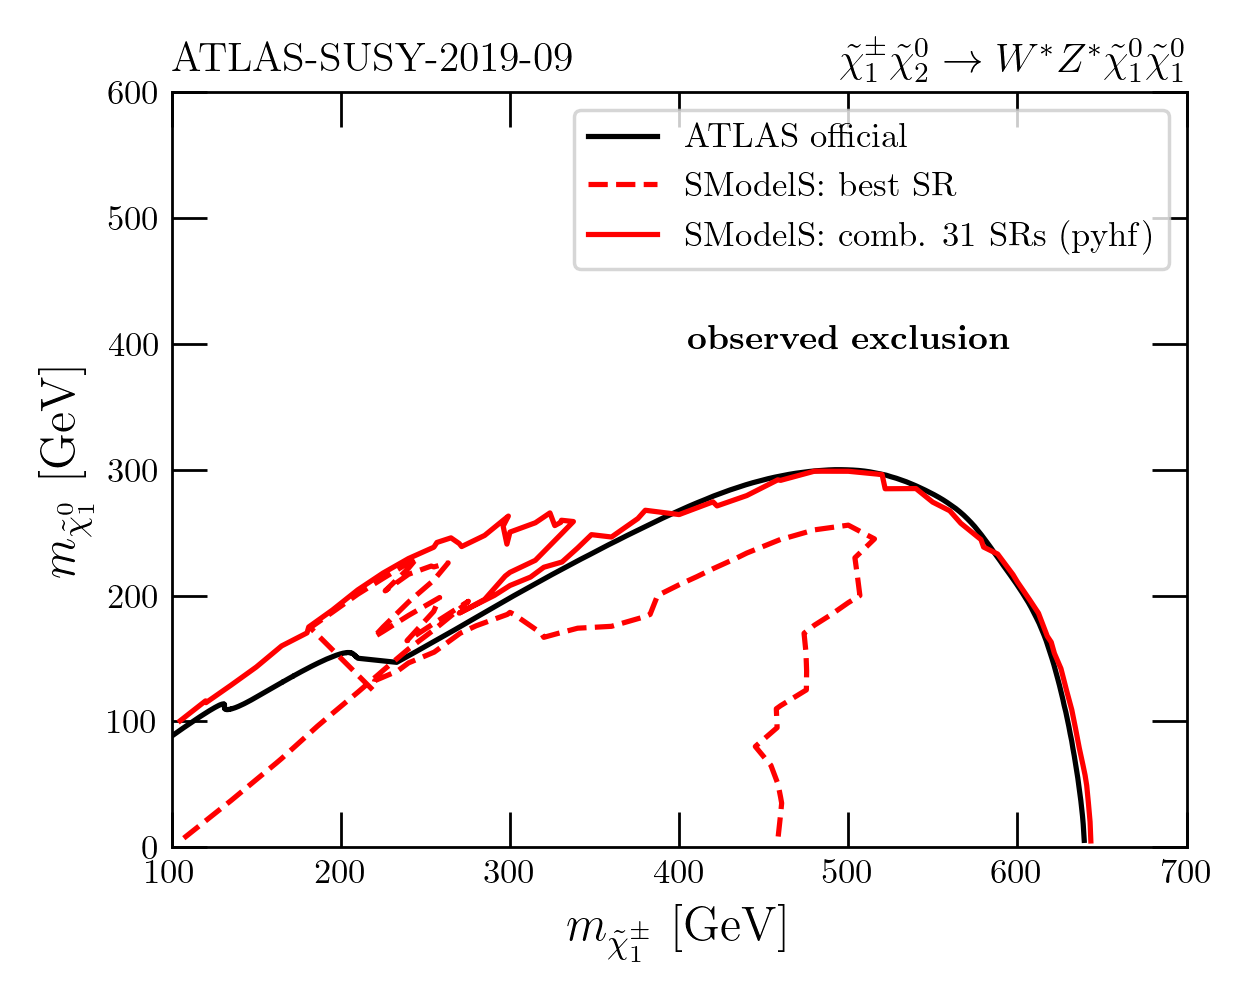
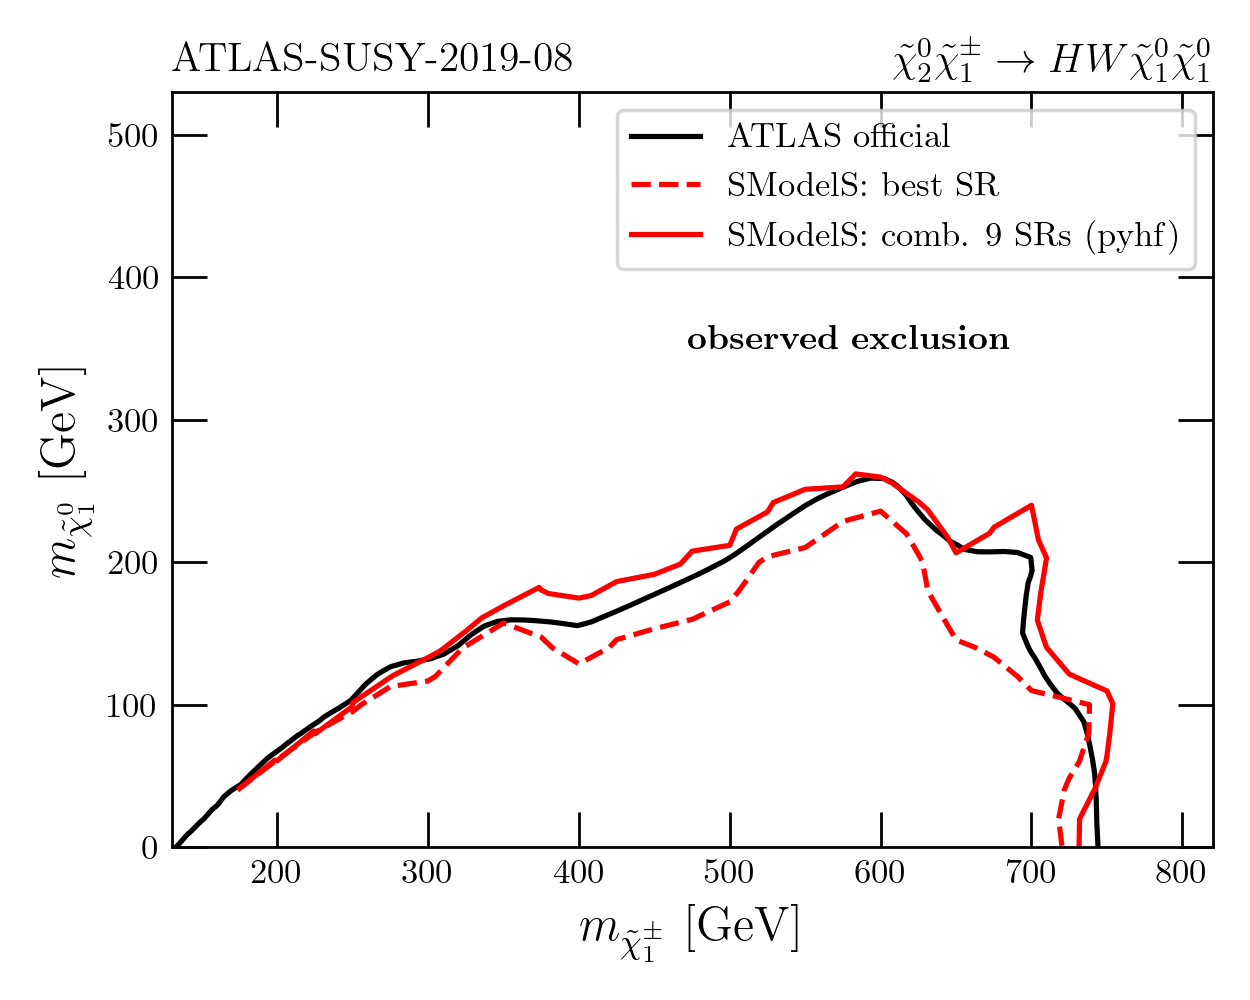
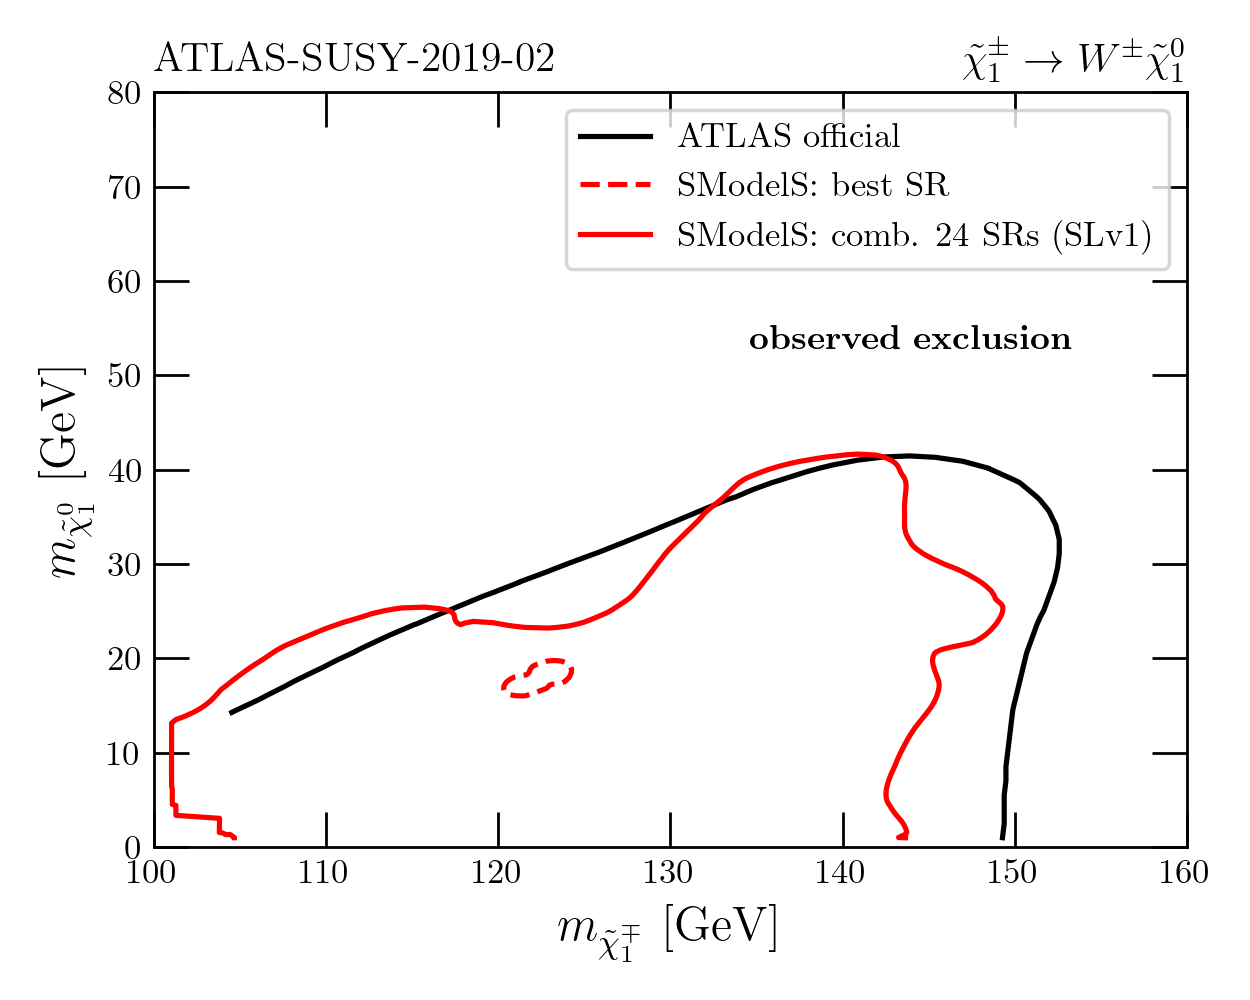
Validation plots: comparison of best-SR vs SR combination
This page collects all validation plots that show comparisons of statistical models: best signal region only versus statistical models at varying degrees of complexity. The list has been created from the database version 3.1.1, considering also superseded results. Go to ATLAS 13 TeV results, CMS 13 TeV results. There are no 8 TeV results with statistical models.
There is also a ListOfAnalyses, a ListOfAnalysesWithSuperseded, and Validation.
ATLAS
CMS
| # | Analysis ID | TxName | Plot |
|---|---|---|---|
| 1 | CMS-SUS-21-002 | TChiWZ | 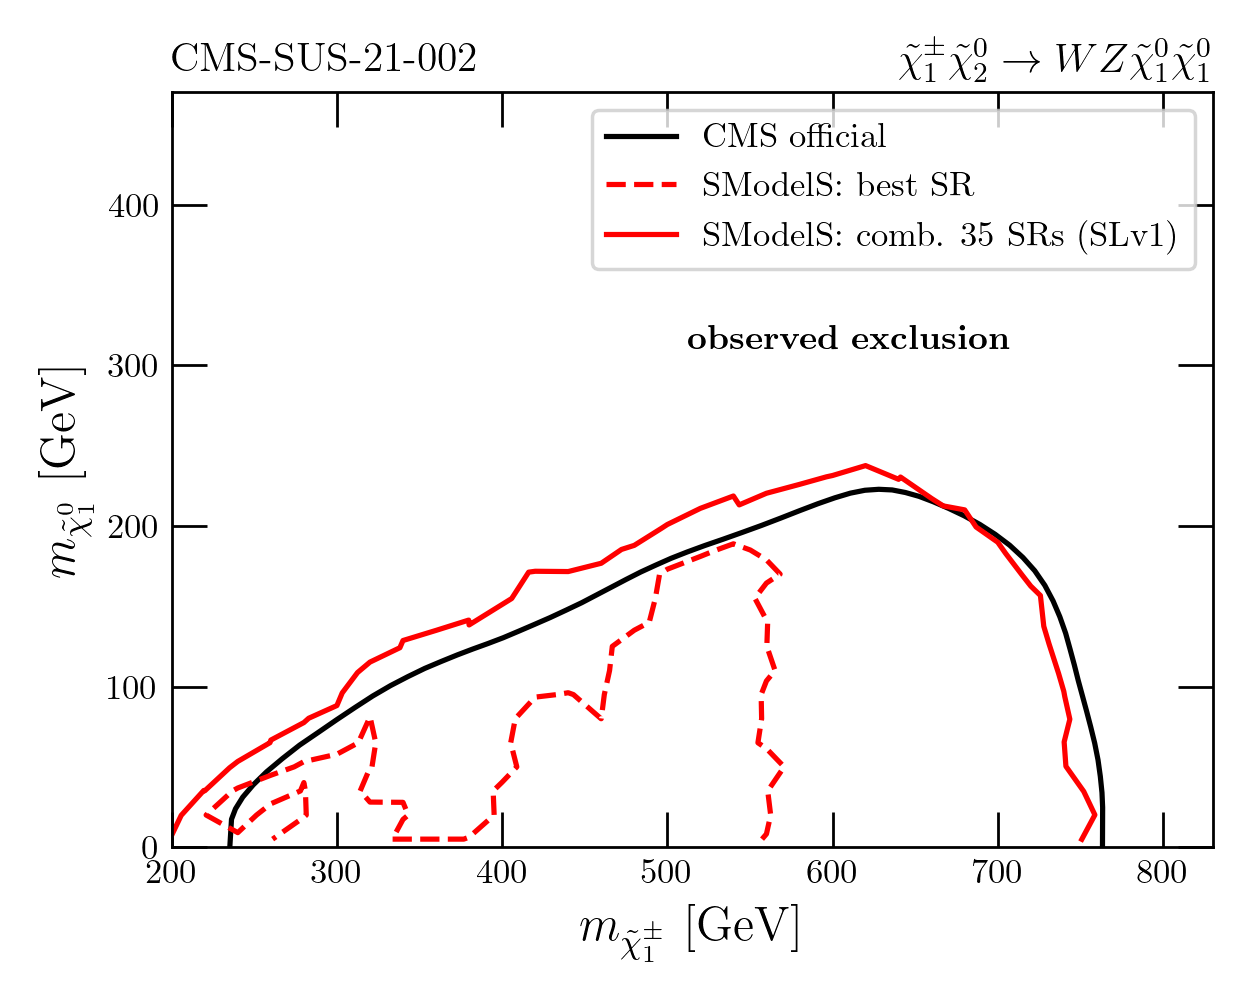 |
| 2 | CMS-SUS-21-002 | TChiWW | 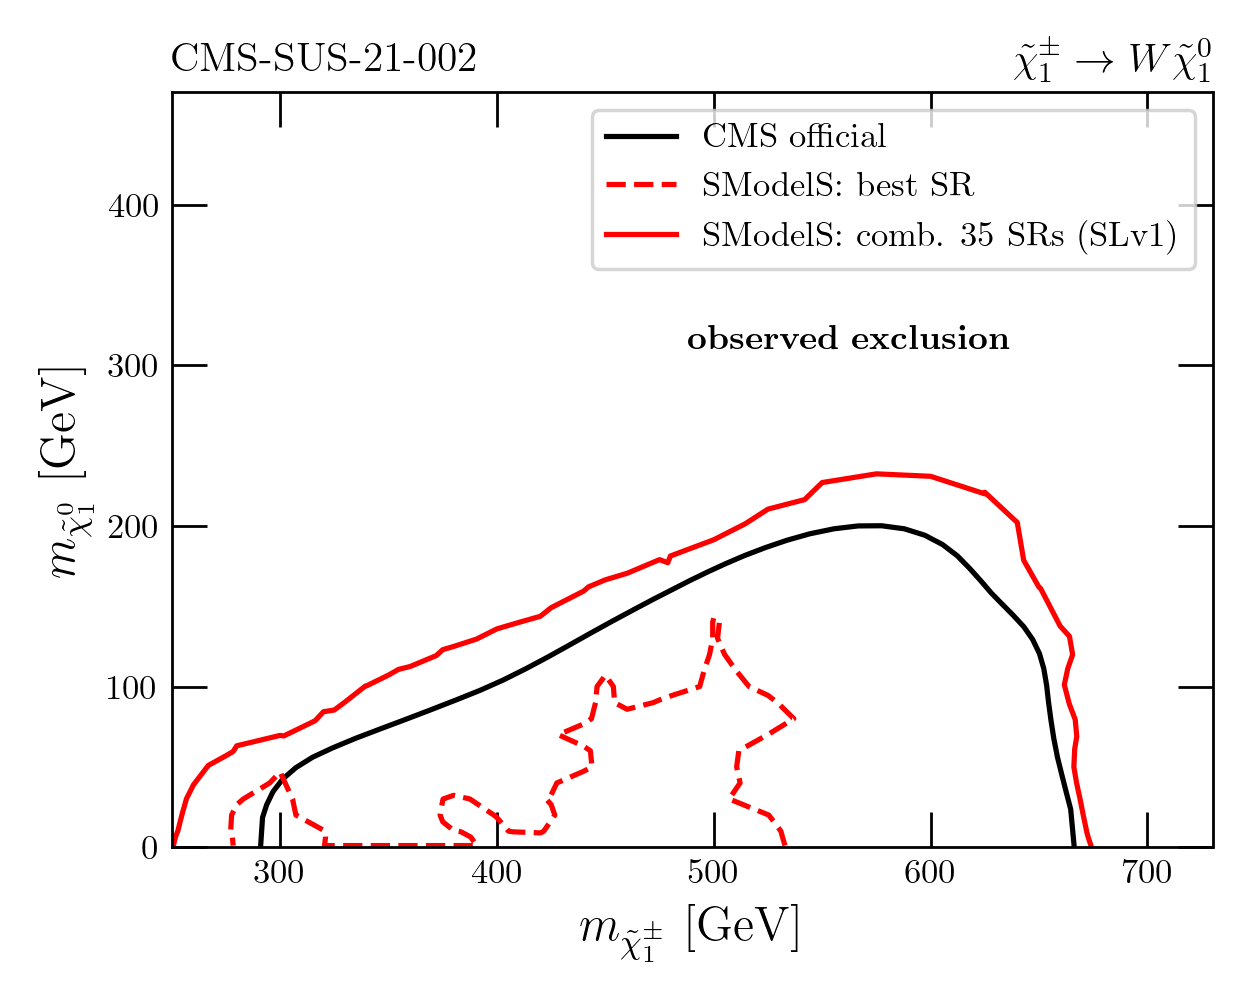 |
| 3 | CMS-SUS-21-002 | TChiWH | 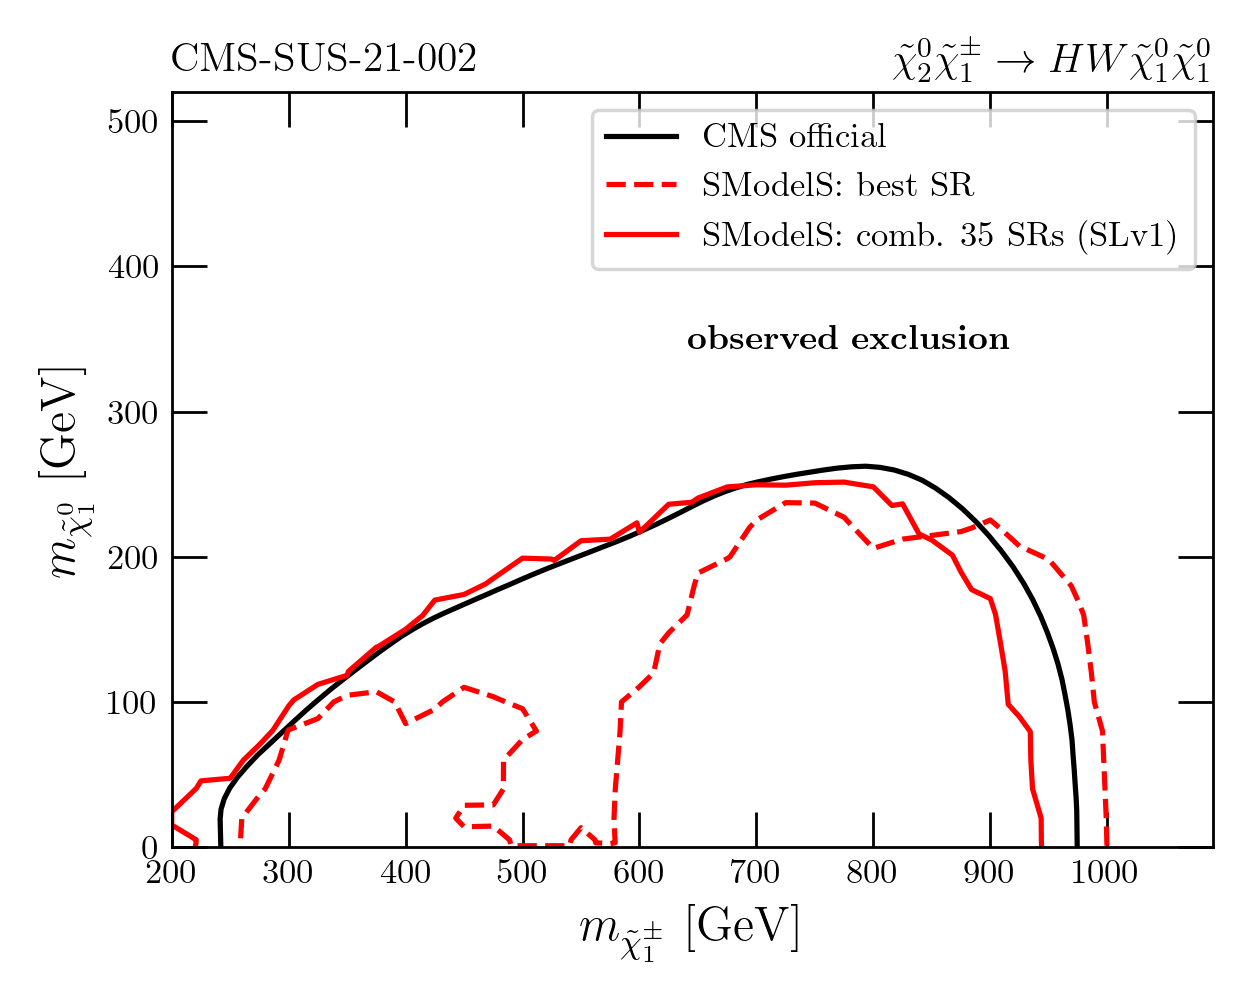 |
| 4 | CMS-SUS-20-004 | TChiHH | 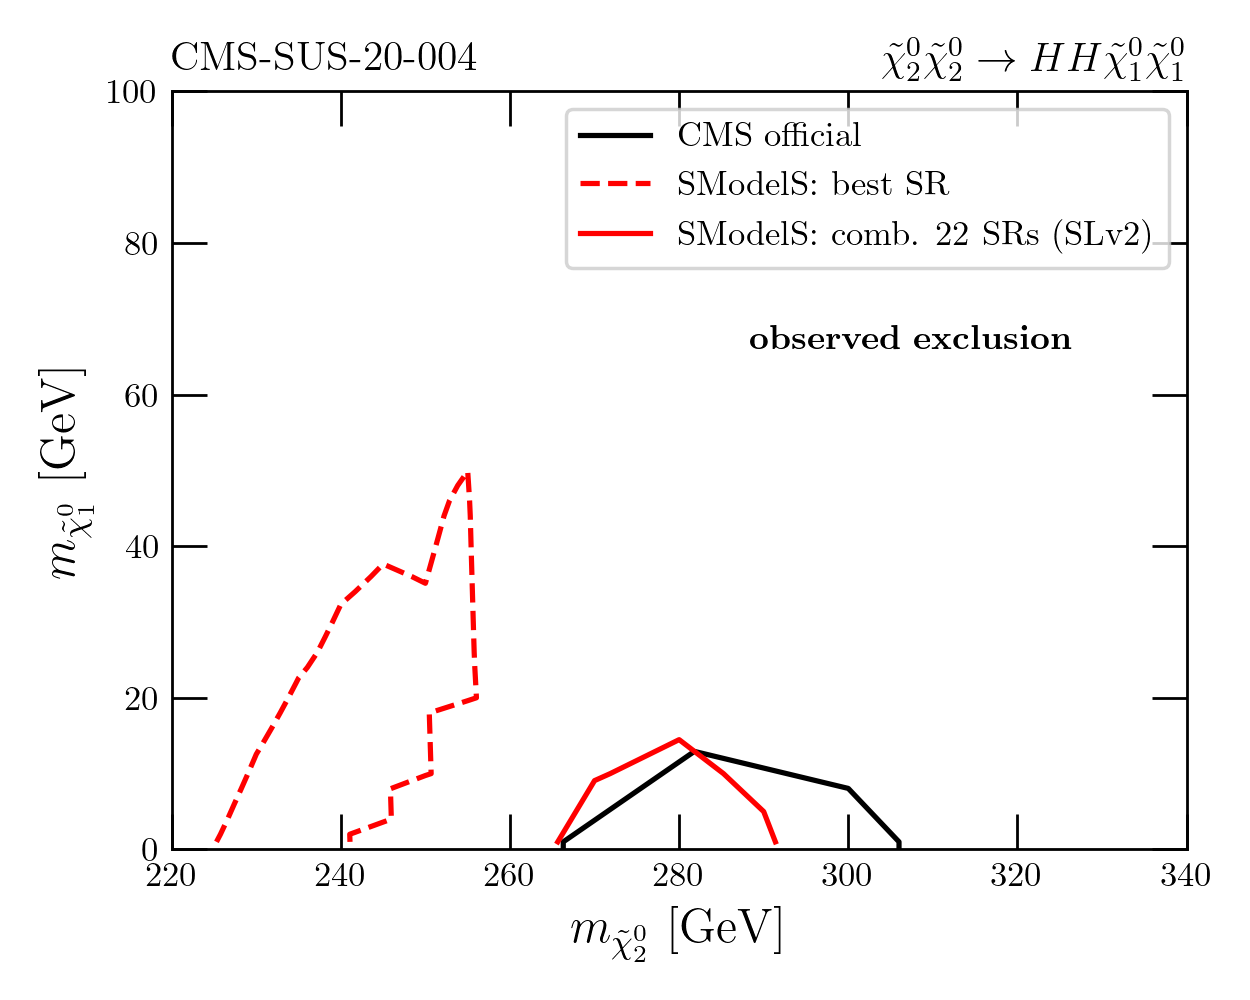 |
| 5 | CMS-SUS-20-004 | TChiHH | 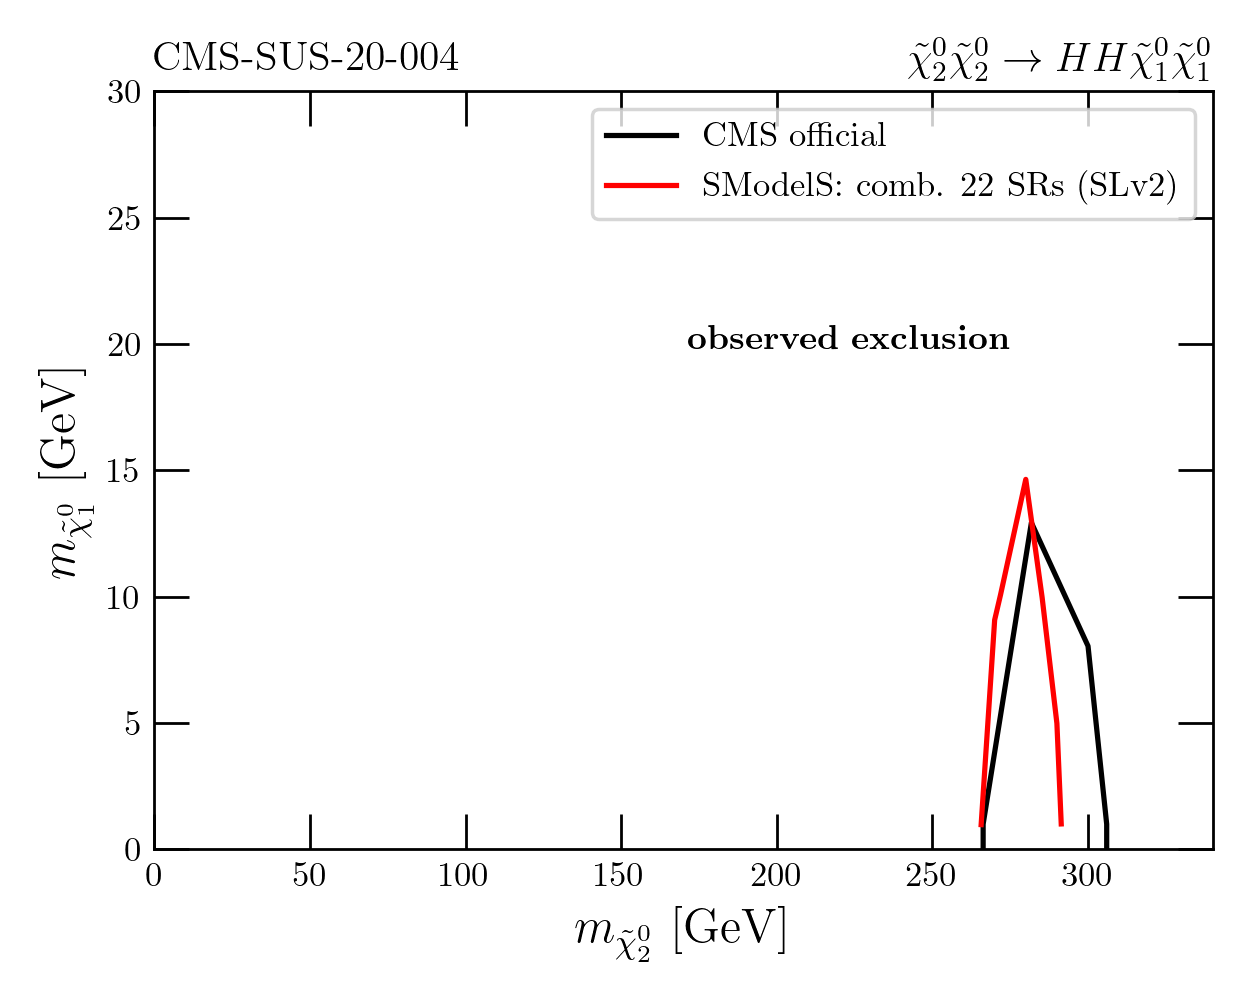 |
| 6 | CMS-SUS-19-006-agg | T2tt | 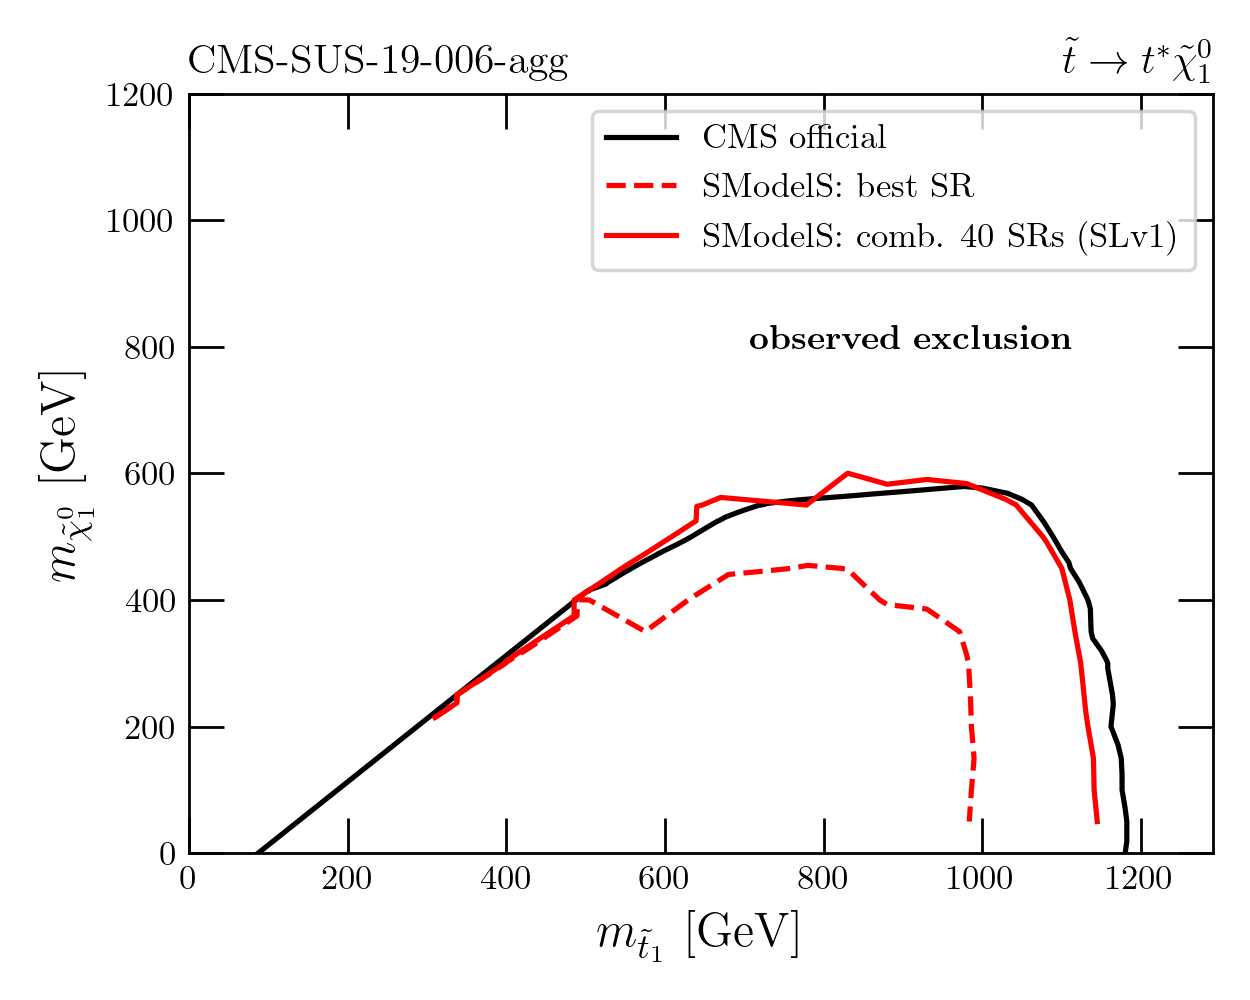 |
| 7 | CMS-SUS-19-006-agg | T2bb | 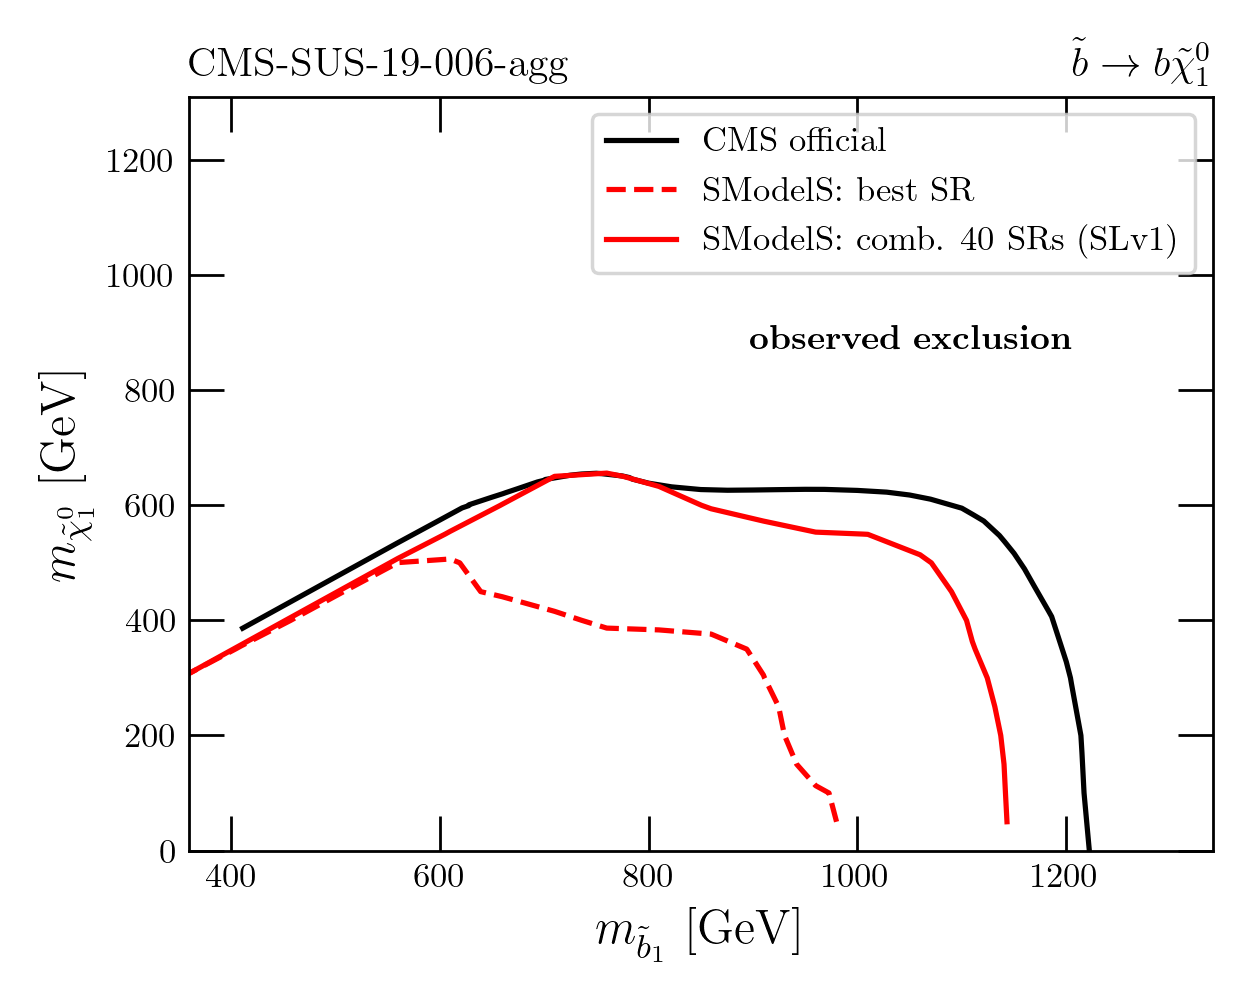 |
| 8 | CMS-SUS-19-006-agg | T2 | 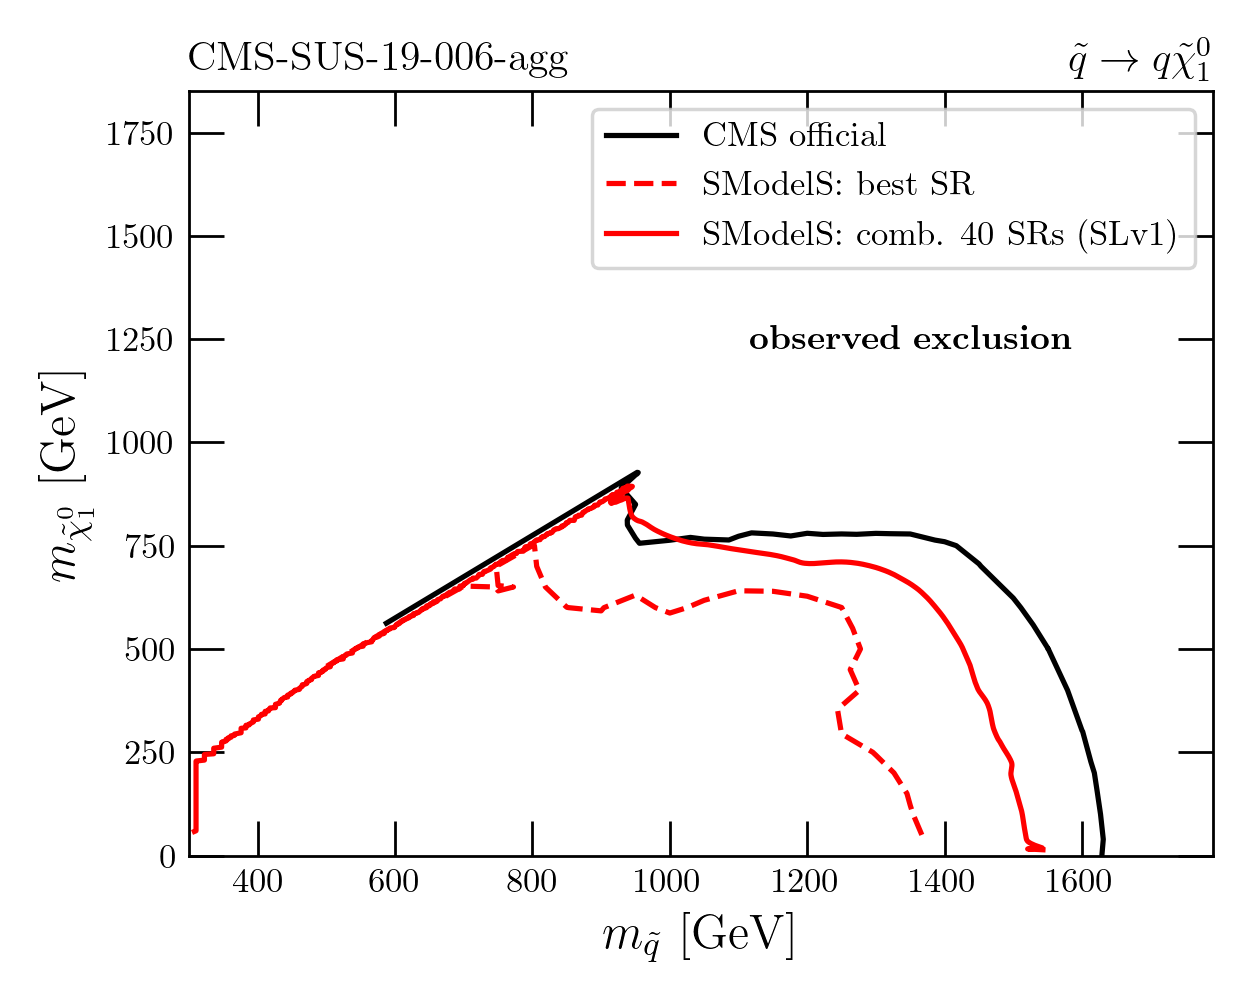 |
| 9 | CMS-SUS-19-006-agg | T1tttt | 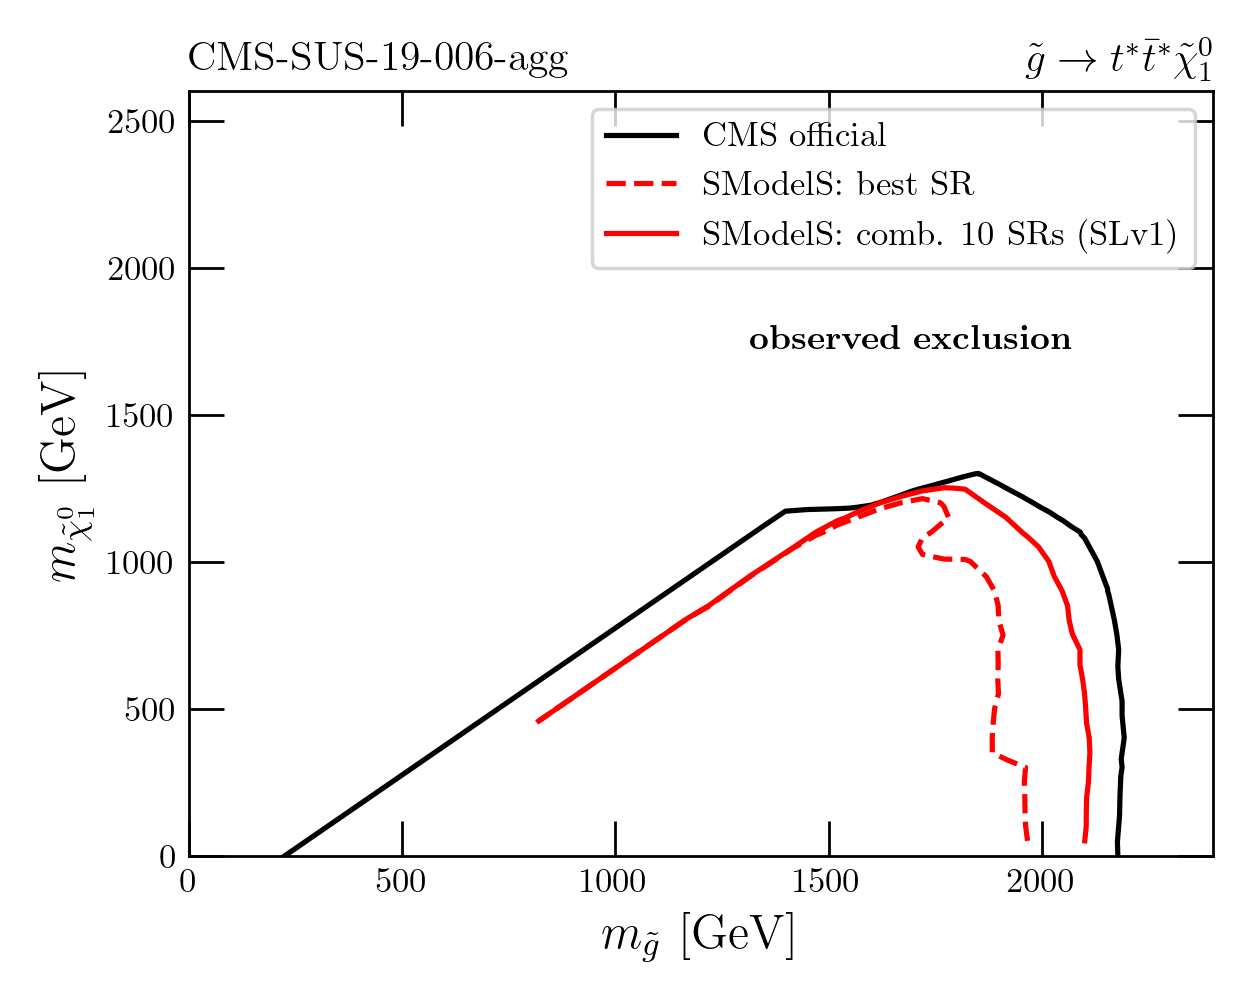 |
| 10 | CMS-SUS-19-006-agg | T1bbbb | 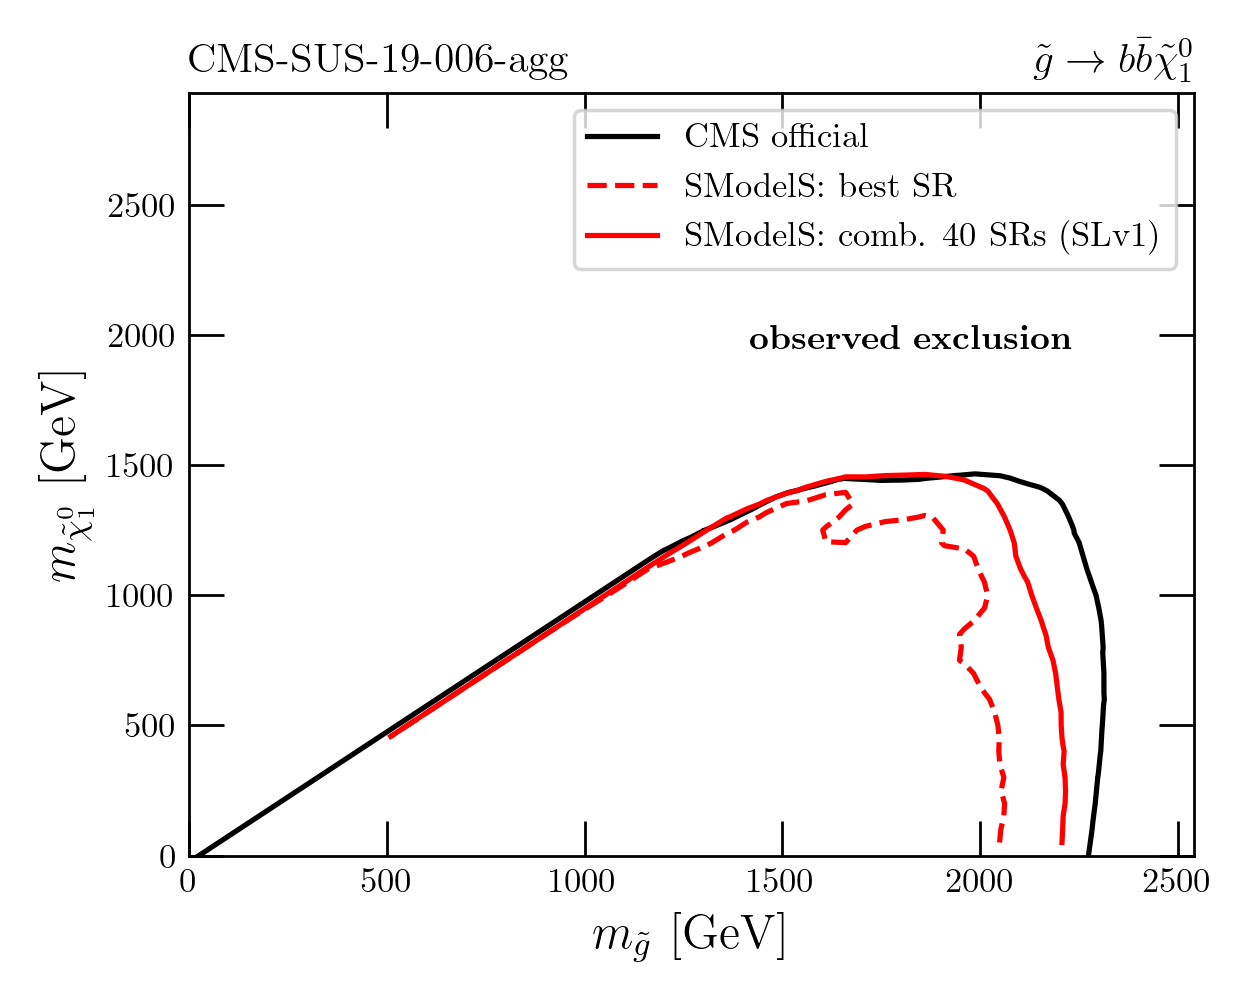 |
| 11 | CMS-SUS-19-006-agg | T1 | 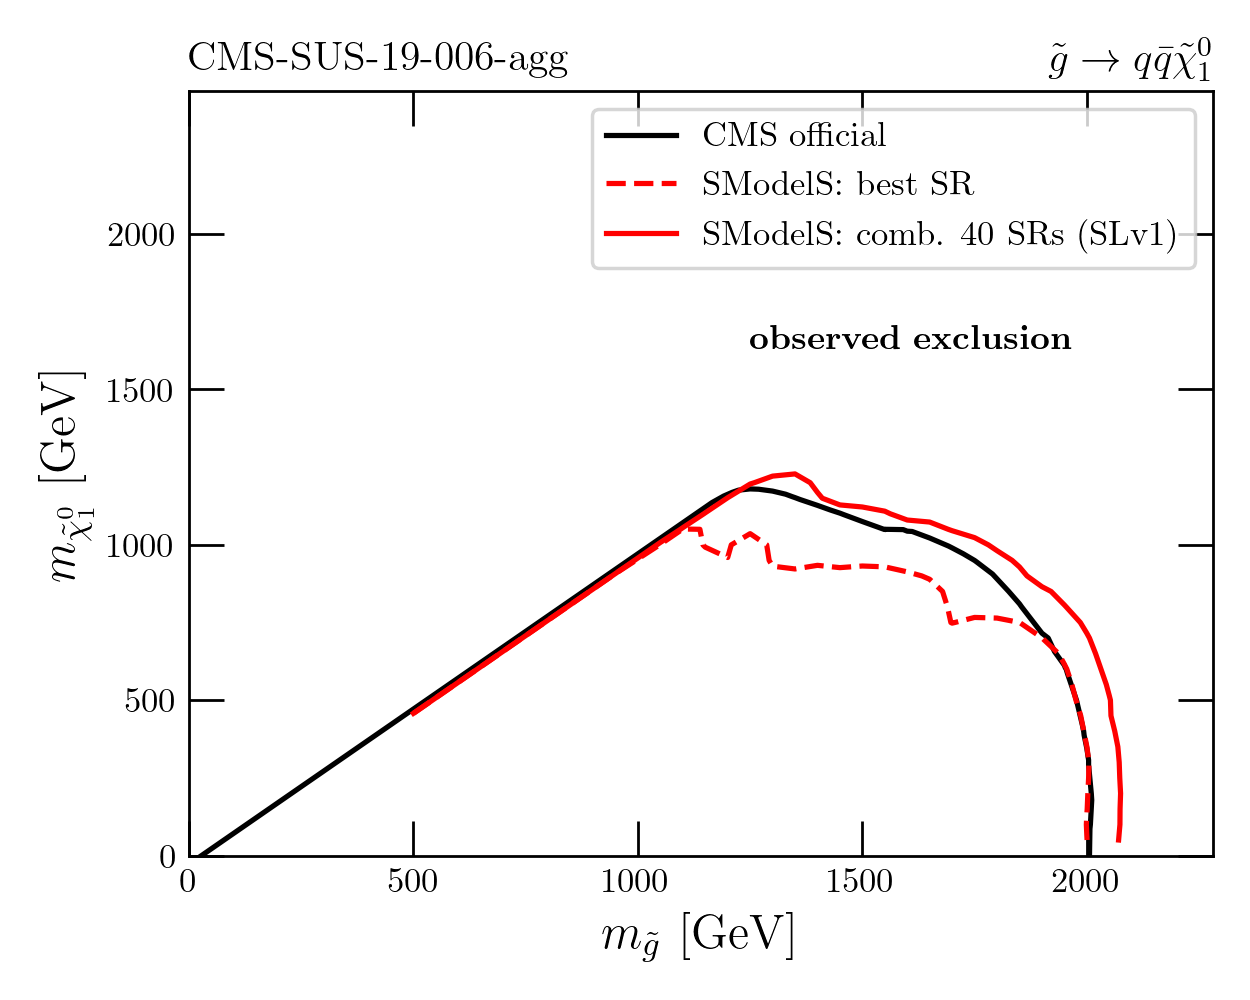 |
| 12 | CMS-SUS-16-050-agg | T5tctc | 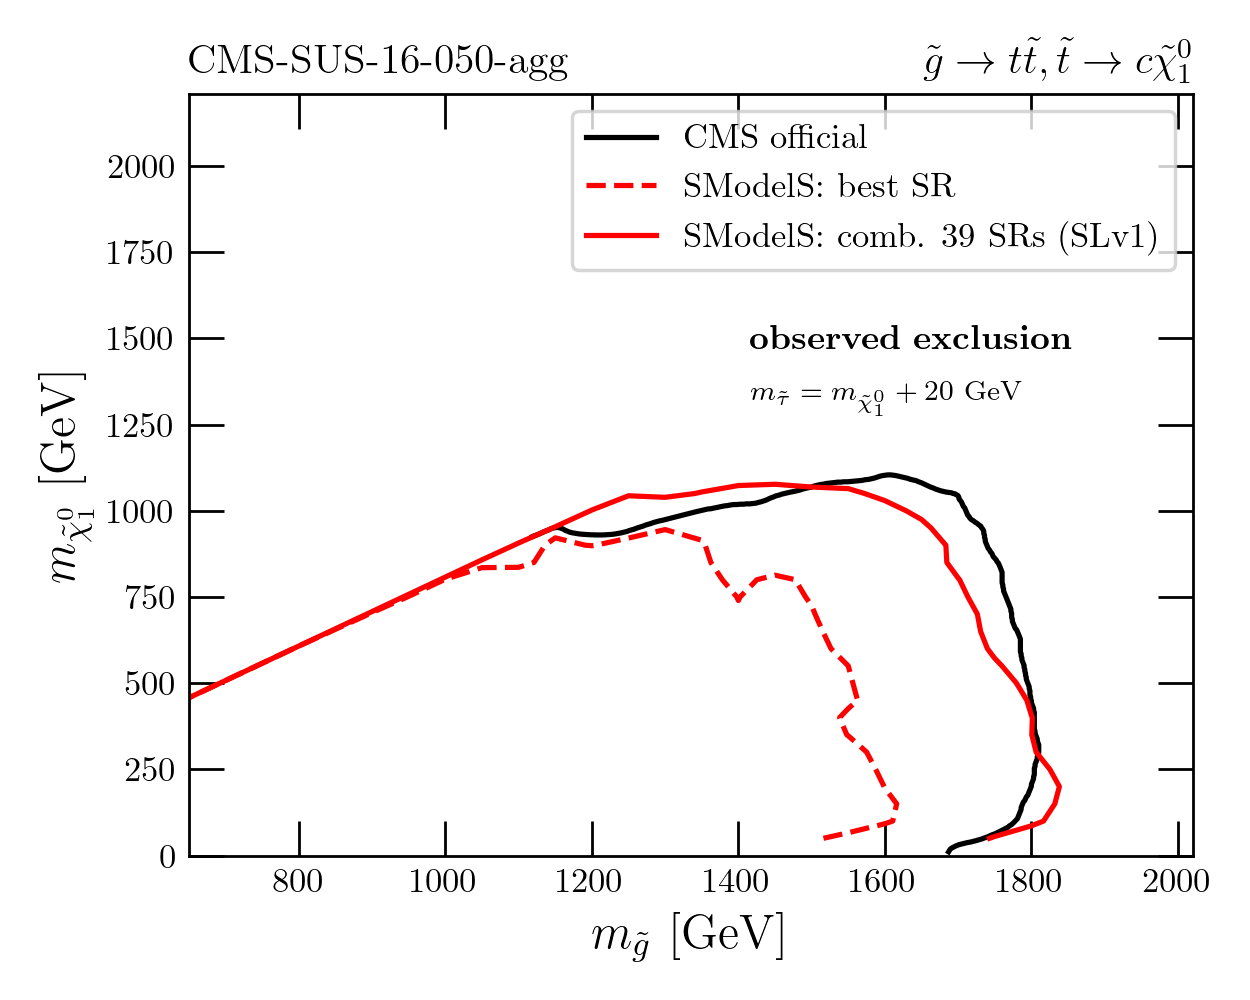 |
| 13 | CMS-SUS-16-050-agg | T2tt | 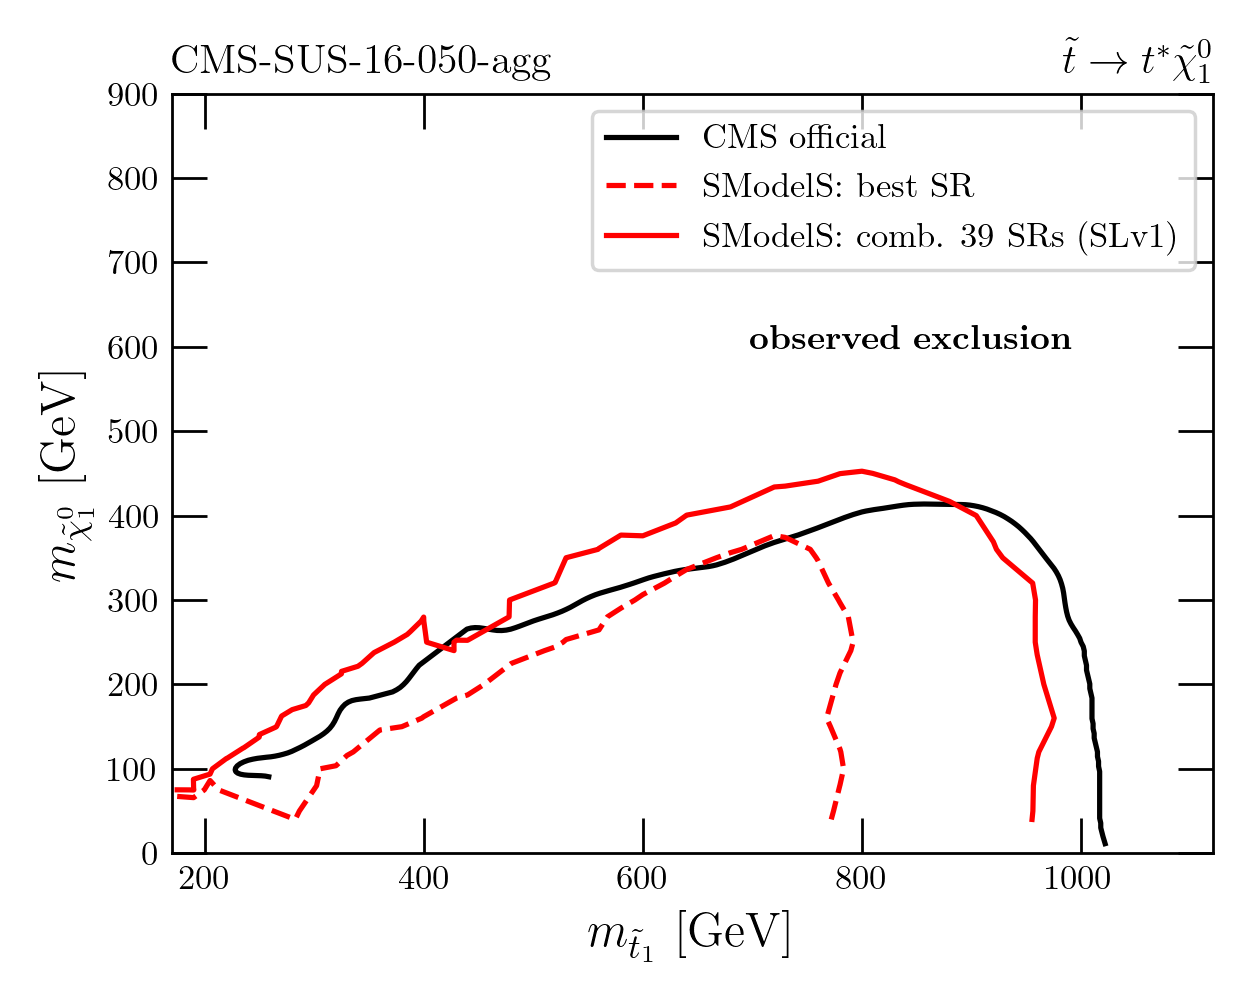 |
| 14 | CMS-SUS-16-050-agg | T1tttt | 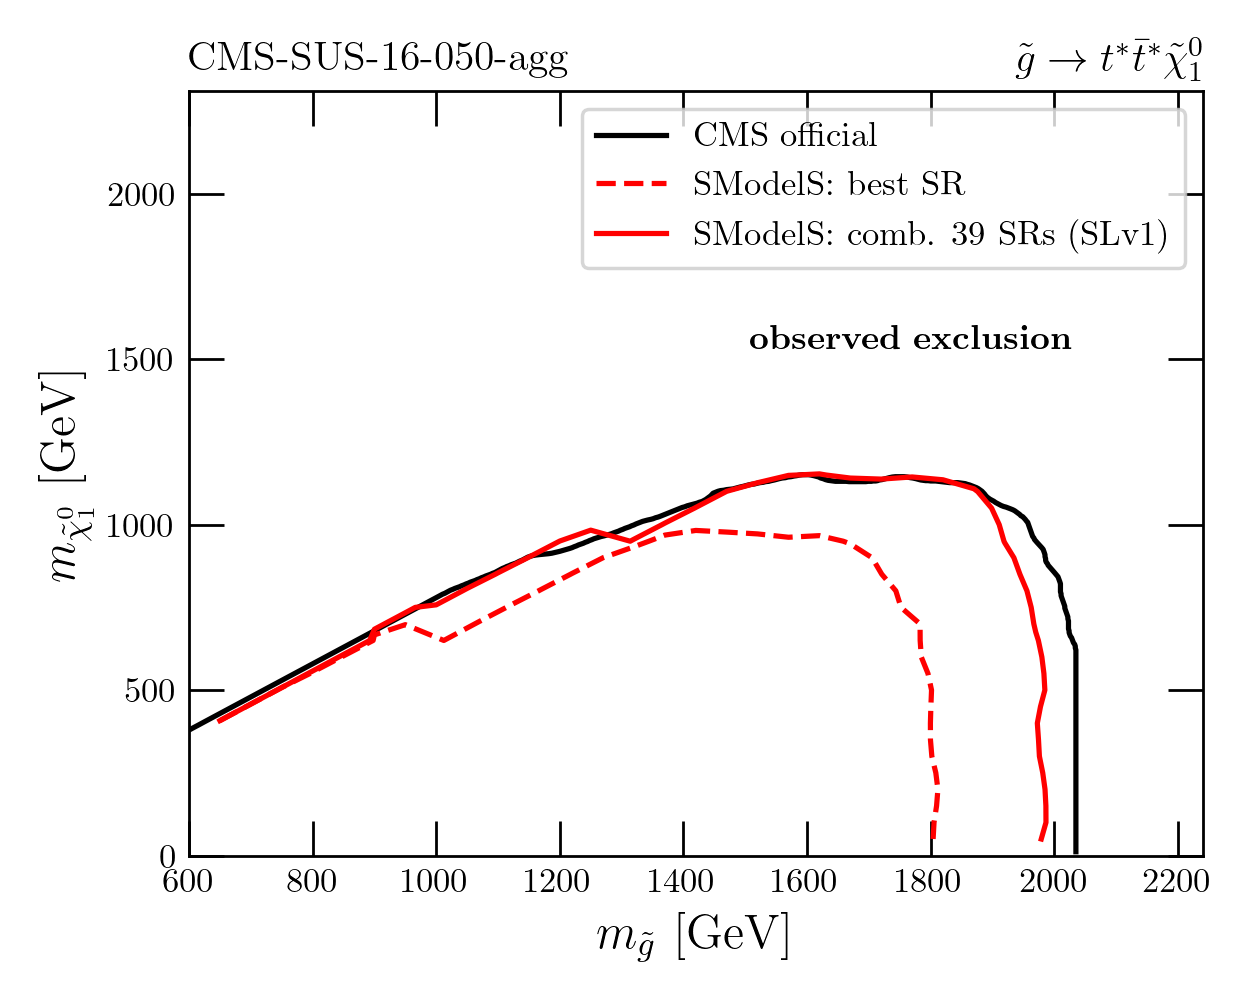 |
| 15 | CMS-SUS-16-048-ma5 | TChiWZoff | 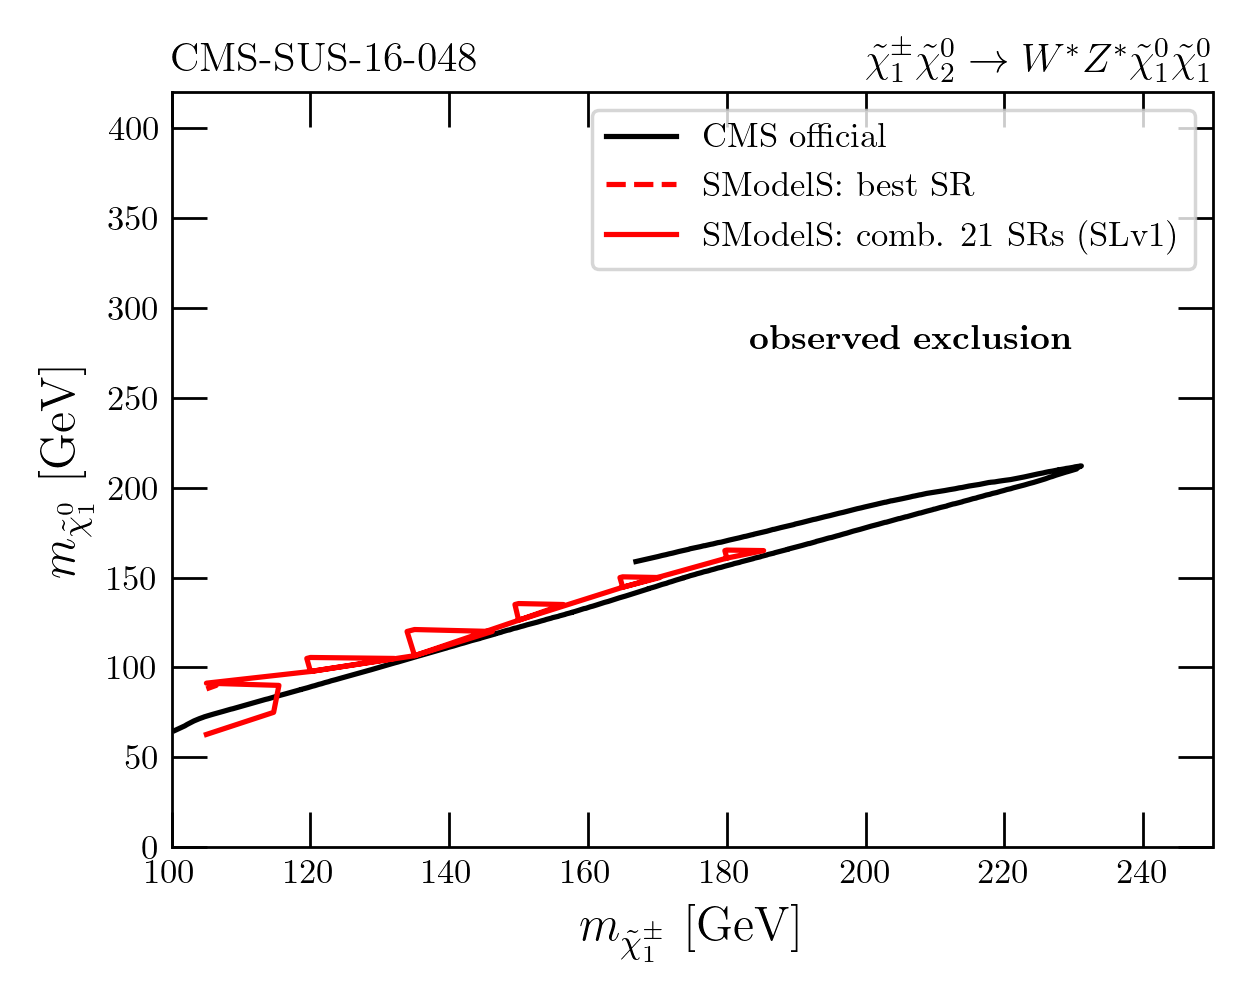 |
| 16 | CMS-SUS-16-039-agg | TChiWZoff | 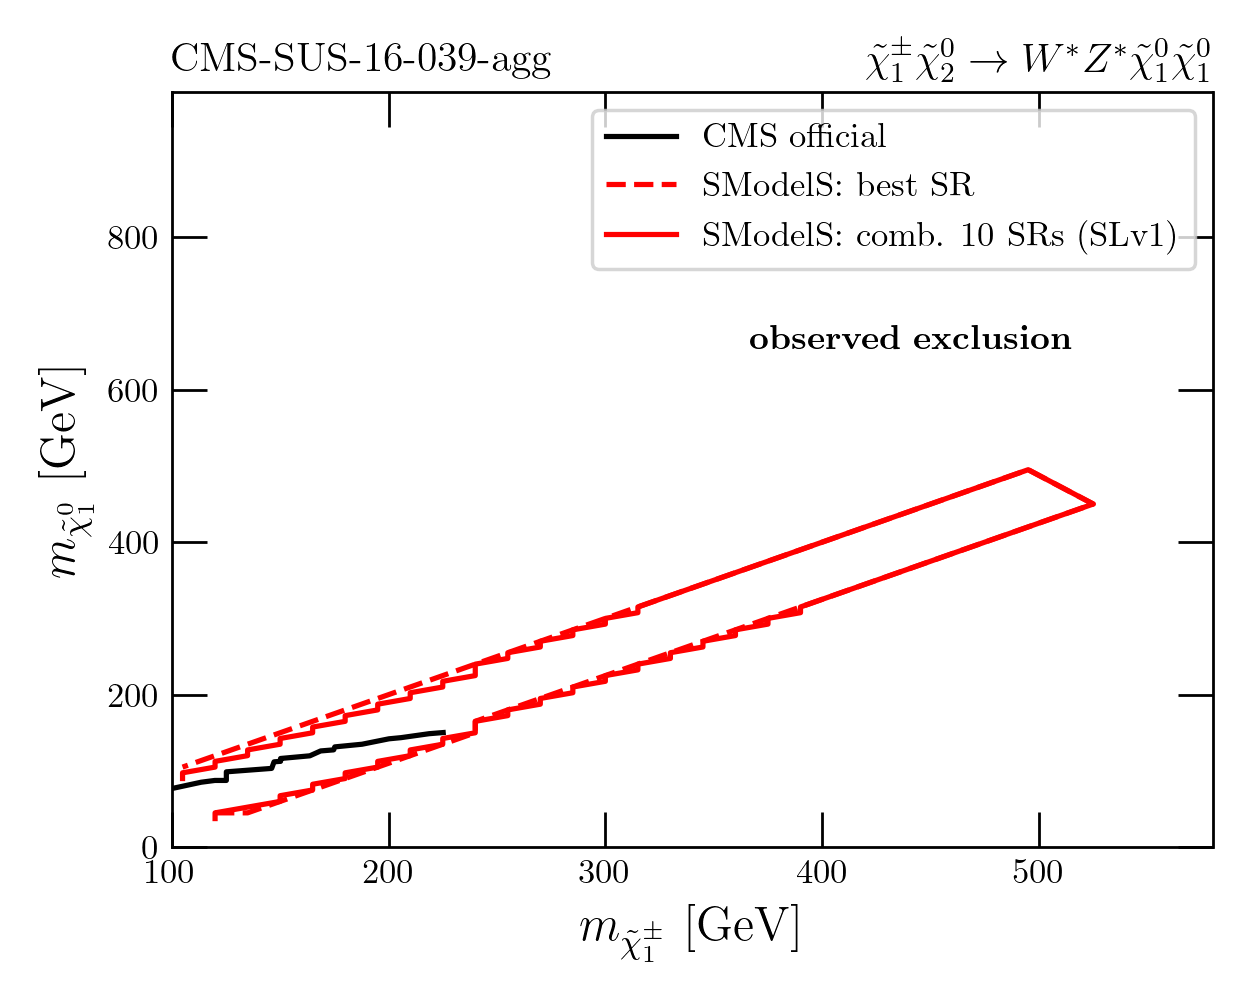 |
| 17 | CMS-SUS-16-039-agg | TChiWZ | 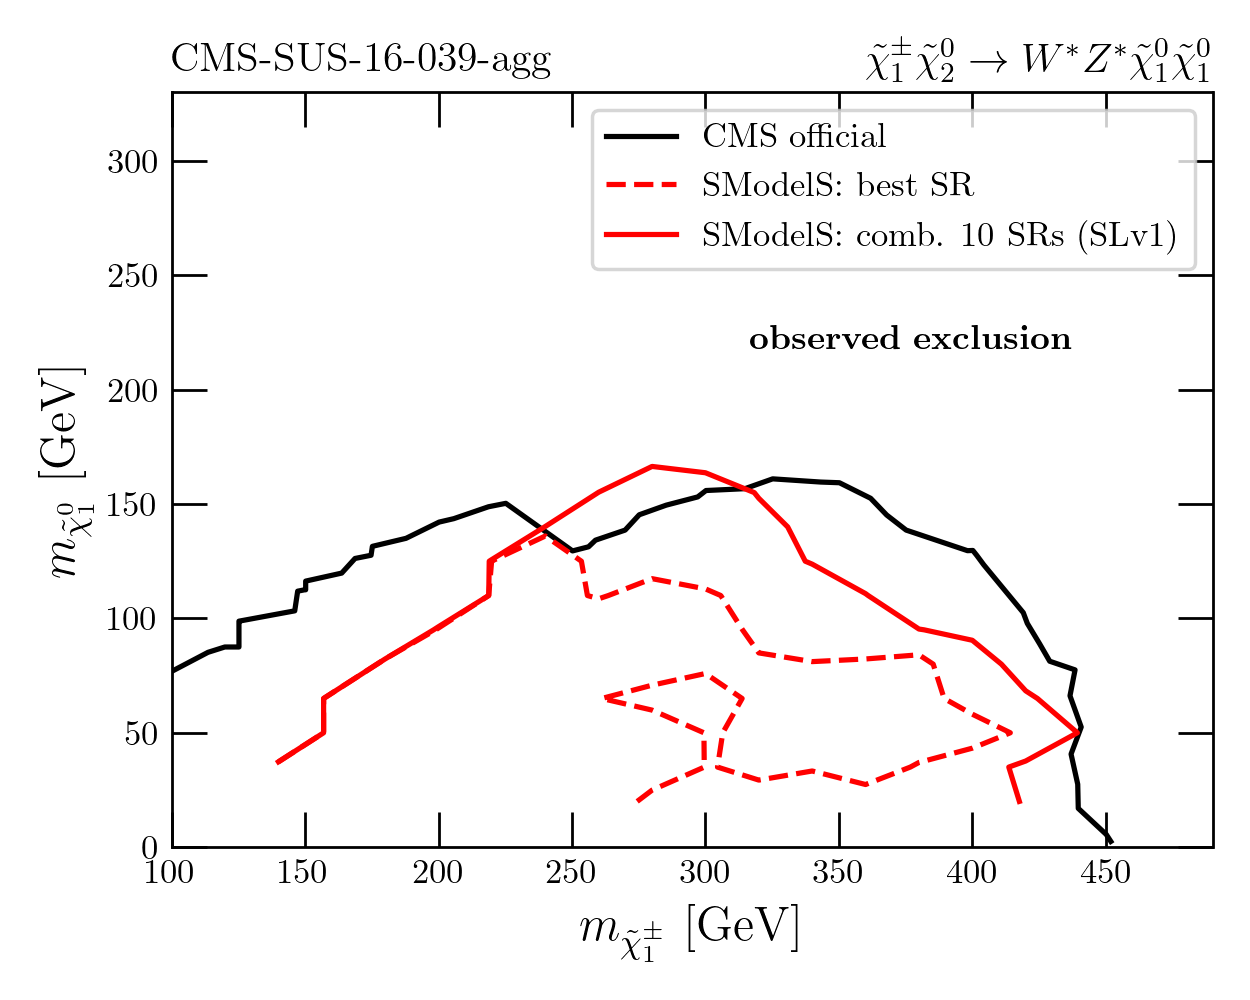 |
| 18 | CMS-PAS-SUS-16-052-agg | T6bbWWoff | 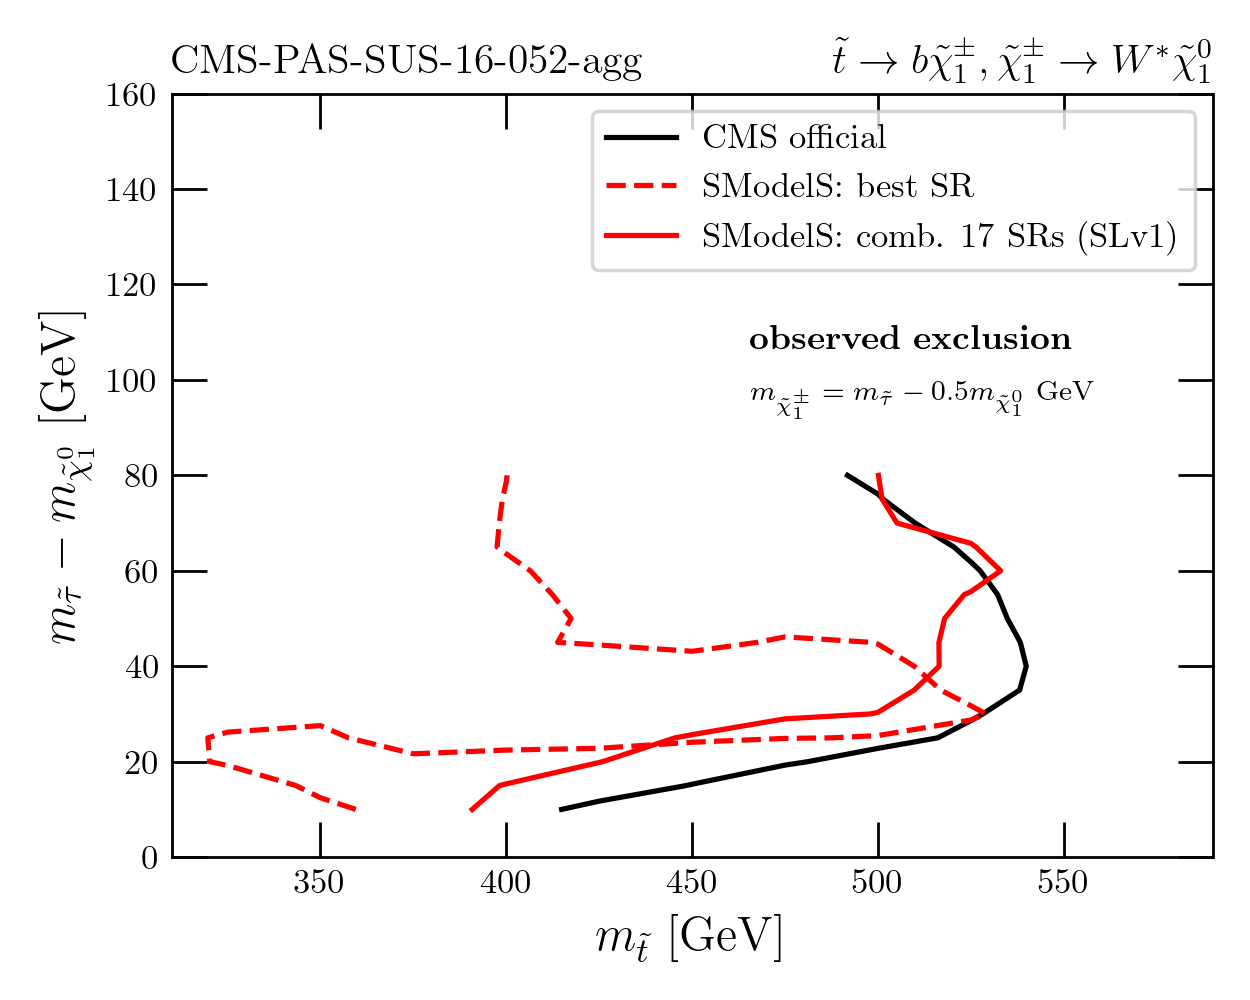 |
| 19 | CMS-PAS-SUS-16-052-agg | T2bbWWoff | 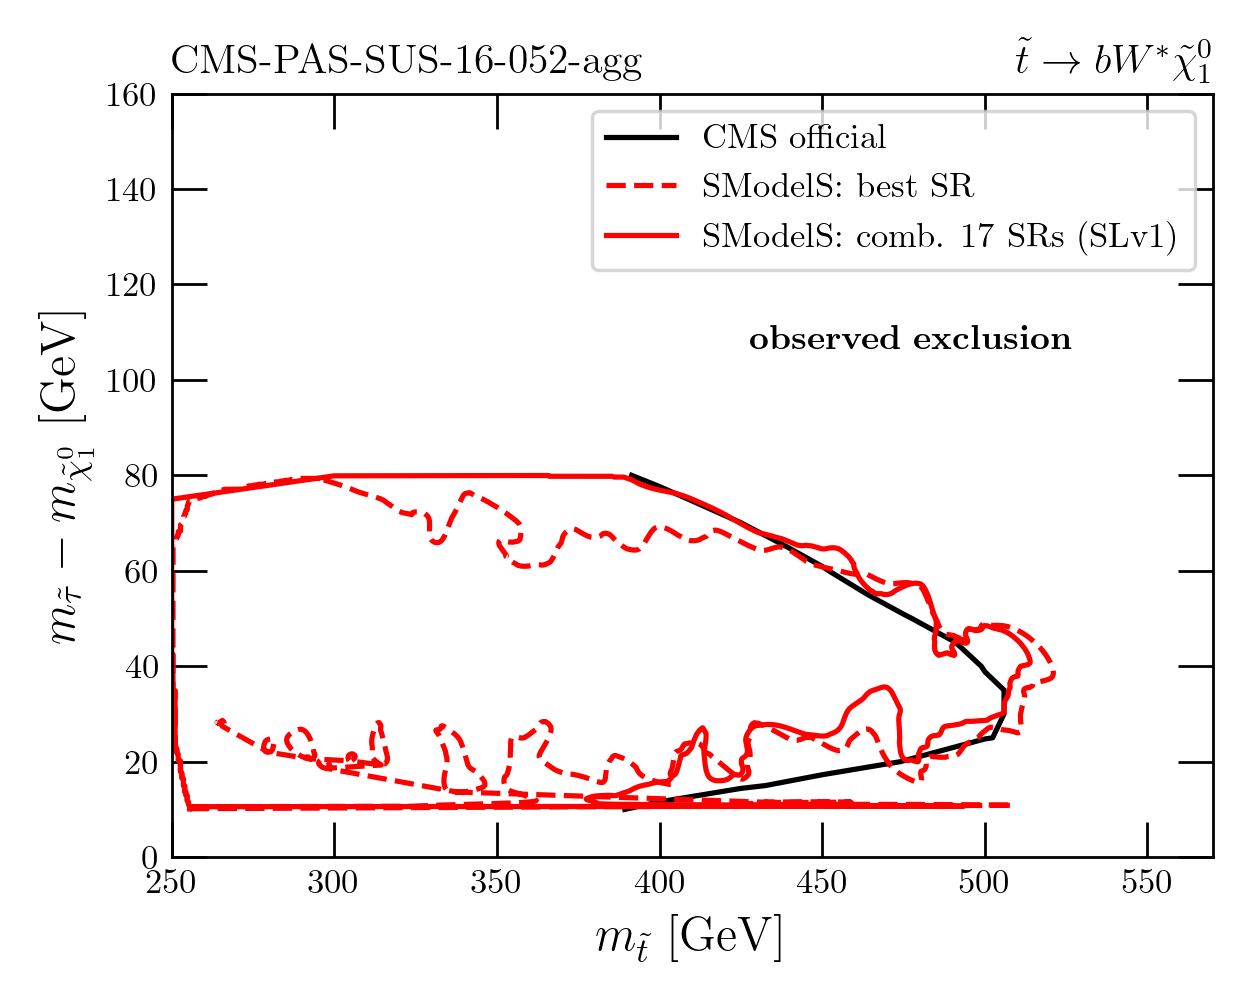 |
| 20 | CMS-EXO-20-004 | TRV1 | 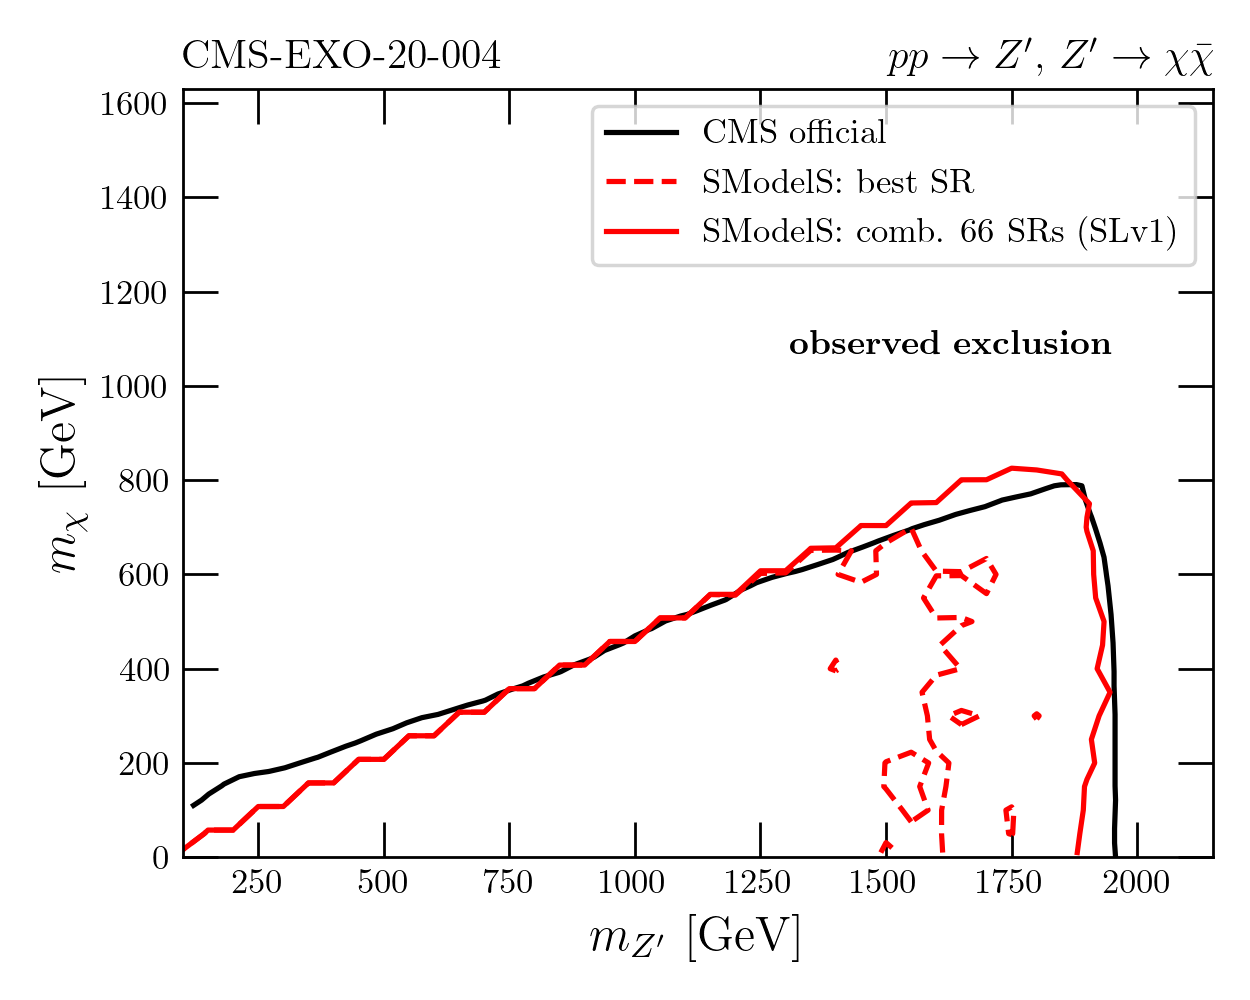 |